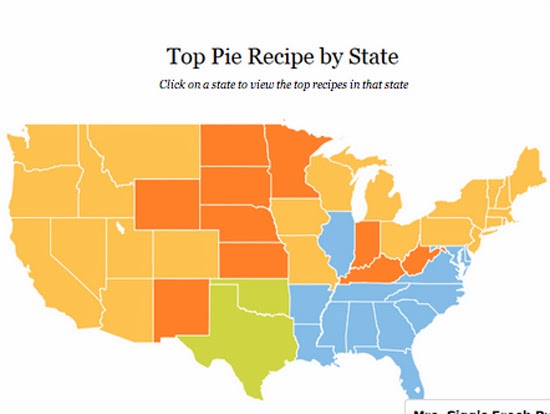
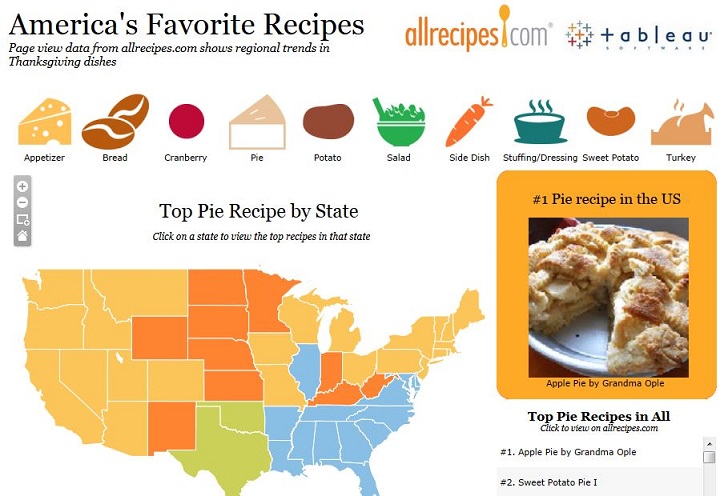
Wondering what to cook for Thanksgiving? This is a question asked all across the United States this time of year, but the answer often depends on where you live. Big data analysts at AllRecipes.com and Tableau Software worked to parse over 78 million recipe page views stretching from last Thanksgiving to uncover most popular foods by state.
The Recipe.com team used Adobe SiteCatalyst to track the page views, Amazon Web Services EC2 & S3 to get the raw data from Adobe and AWS RedShift to store and query the raw transactional data. They then sent about 2.5 million records — the page-view count of every recipe in every state — to a data analyst at Tableau. The analysis took a couple of days to design the interactive web visualization depicted below. You can try out the actual interactive visualization HERE.


Speak Your Mind