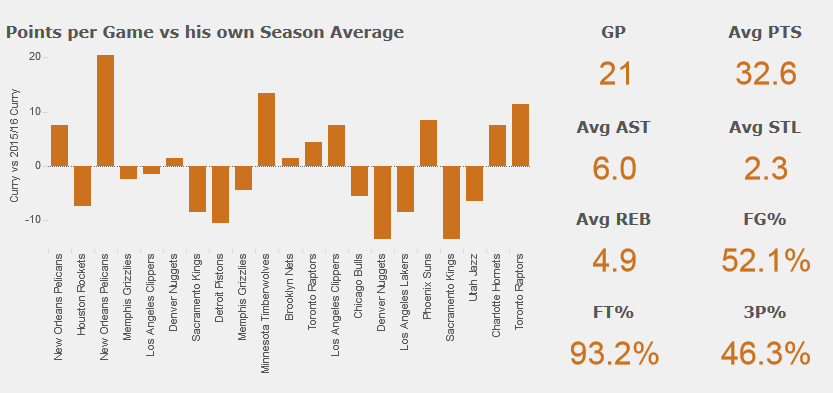
With the Golden State Warriors setting an NBA record for most consecutive wins to start a season it was time to have a closer look at Steph Curry. Using Tableau Public, data author Carl Allchin produced a compelling data visualization that encapsulates star Steph Curry’s performance on the court. You can visit HERE to use an interactive version of the visualization. You can select a team Curry tortured to analyze and see how he moved around the court along with the points, rebounds, steals and assists he contributed to the win.
Sign up for the free insideBIGDATA newsletter.


Speak Your Mind