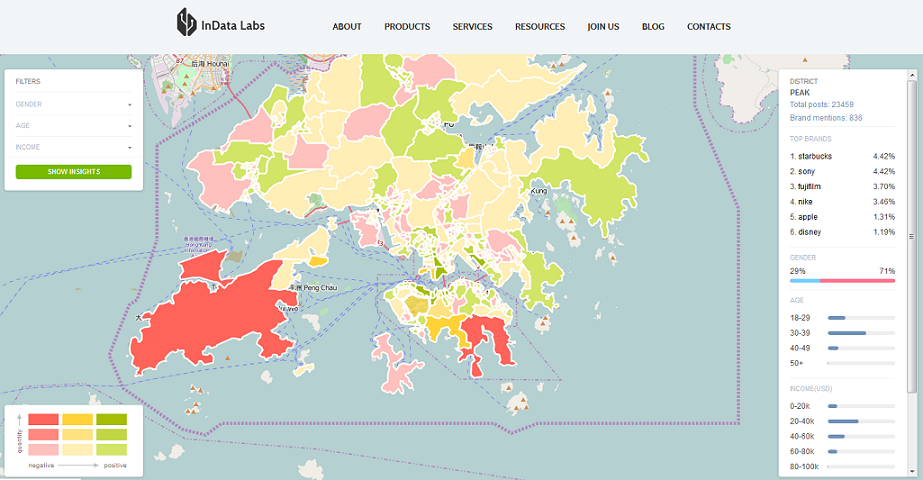
Our friends over at InData Labs with support of Datasia.hk provides our Visualization of the Week with an interactive map of Hong Kong that visualizes all the Instagram activity of the city. The map is telling a story about life in Hong Kong by showing who posts what and from which locations. It also provides location-based insights on Instagram users from Hong Kong. You can visit HERE to use an interactive version of the visualization. You can click on different locations on the map to expose details. More than 1.5 million Instagram posts have been gathered to create this interactive infographics. All of the posts are geo-tagged so that mapping them out was possible. The colors on the map show density and sentiments of Instagram posts across Hong Kong.
The research is unique because it’s the first and the only one that defines demographic characteristics and income rate of Instagram users in Hong Kong,” says Sergey Enin, Director of Technology Solutions at InData Labs.
Sign up for the free insideBIGDATA newsletter.


Speak Your Mind