 In this special guest feature, Adam Mollenkopf, Real-Time GIS Capability Lead at Esri, discusses how geospatial technology helps companies make the most of real-time data. Adam is responsible for the strategic direction Esri takes toward enabling real-time GIS capabilities in the ArcGIS platform. He leads a team of experienced individuals in the area of geospatial and temporal stream processing. Esri is a leader in GIS technology. The Esri platform (esri.com/arcgis) integrates sensor data, cloud services, and core business systems with powerful data management and analytic capabilities so that any organization can capture the power of real-time data and put it to work.
Real-time data flows all around us. From ocean sensors to smartphones, the broad range of things that stream data to the Internet have one common characteristic—location. A geospatial platform brings data streams into a sophisticated mapping environment in which users perform powerful analysis and find new potential in practically every type of industry. Leading edge vendors provide big data technology that accesses and ingests high-velocity and high-volume real-time data for mapping and analysis.
Companies that wait to step into the big data stream risk losing customers to those that have already adopted real-time data technologies. Bringing geospatial technology to the vast Internet of Everything (IoE) opens opportunities that are only visible within a geographic context.
The process of accessing, mapping, and analyzing data creates intelligence for improving services and growing market share. By accessing data from social media feeds, a marketing analyst maps the latest customer feed related to a product. Using an intelligent map, the analyst monitors customer preferences and concerns and gauges public sentiment in a geographic context. Applying big data analytics, the analyst adds demographic and income information within those areas to better understand customer types; target advertising; and, most certainly, grow sales.
Real-Time Mapping Benefits
Real-time data management and visualization have been game changers for utilities. Their systems ingest sensor data streamed from power poles and transform it into location-based intelligence for moderating energy use, planning for peak capacity, and avoiding brownouts.
Flood management districts use sensors to detect rising waters upstream that actuate a trigger within the system to issue a flood warning in time for people living downstream to evacuate. Hydrologists scale up local stream-level data by linking it to a national stream map. Conversely, they scale down real-time data to their immediate local needs.
With the right geospatial tools, decision-makers see events unfold before them in real time. A dashboard provides specific operational insight to a single manager, or an entire common operating picture to disaster response agencies. Harnessing real-time data and locating it on a live map have enormous implications. Fire, law enforcement, and emergency response staff share real-time information to collaborate across jurisdictions during a large-scale disaster. Urban analysts use real-time dashboards to better understand urban mobility and sustainability.
The highly popular geofence, which aids fleet management and law enforcement, is a rule-based app. By drawing a perimeter around a neighborhood on a smart map, the user sets up a digital geofence. When a sensor attached to a vehicle or smartphone crosses the geofence, the platform triggers an action. A tourism department sets geofences around public attractions so that visitors receive informative texts while they explore the city’s points of interest.
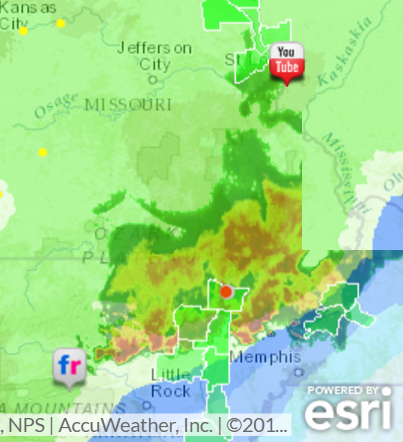
The US Flooding Information Map depicts live IoE data streams including flood levels from sensors and photos from social media.
Internet of Everything Mapping Solution
The Internet of Everything encompasses the Internet of Things, as well as people, processes, maps, and more. Gartner reports that 6.4 billion connected things will be in use worldwide by the end of 2016. As the number of devices connecting to the Internet grows, monitoring systems must adapt. Their architecture needs to accommodate many types of devices and connect to any data stream. A sophisticated geographic information system (GIS) includes connectors to GPS and mobile devices, social media, and other streaming data resources.
The challenges companies face in using the IoE are managing its massive scale and visualizing and analyzing its outputs. Big data management frameworks, such as Hadoop, store large amounts of data and run applications within a computing environment. Developers use Hadoop geospatial toolkits to help them process and bring big data into a geospatial platform. Users can then visualize and analyze IoE data within a geographic context and answer the where questions in their large data stores.
Filters, rule-based apps, dashboards, and visualization help big data managers sculpt big data into useful forms. By defining rules that include or exclude specific data from feeds, managers filter noise from live data. A flood management operator, for example, sets an application to trigger an alert only when a stream sensor reaches a specified water-level threshold.
Sign up for the free insideBIGDATA newsletter.


Speak Your Mind