 In this special guest feature, Avi Avital, VP Customer Success at Anodot discusses the need to empower analytics with anomaly detection capabilities and how this adjunct is becoming a major component of the next wave of BI, or BI 2.0. Avi has an extensive experience in global organizations spanning multiple industries leading technology organizations. In his last role Avi led the Logging and Monitoring product team for PayPal building large scale real-time monitoring platform; he also formed a community of monitoring professional from the leading tech brands. Avi is passionate about driving business value through innovative technologies. He holds MBA from Tel Aviv University.
BI and analytics are essential tools to ensure the right business decisions are made at the right time. Yet, as data volume increases and businesses become more complex this is becoming an increasingly challenging task. Handling scale requires not just new tools, but a fundamental shift in how we approach the task. Instead of just looking at the aggregate data, there must be a new appreciation for the anomaly and its impact on a business. Empowering analytics with anomaly detection capabilities is becoming a major component of the next wave of BI, or BI 2.0.
Every monitoring solution is designed to collect data, process it, and enable detection of issues through alerts or dashboards. Regrettably for the past decade or so, traditional monitoring and BI products have been about overarching statistics and averages. By not looking at data on a more granular level, businesses are missing opportunities to mitigate crises quickly and to uncover what otherwise would have been overlooked opportunities. This is why BI 2.0 is so essential for companies looking for new ways to gain insights from the ever increasing data they are collecting.
Assuming that an organization is looking to invest in BI 2.0, it is important to understand how to measure the effectiveness of the monitoring platform so it can be improved. To begin measuring this, a company must review how individual incidents are being identified, handled, and resolved. Luckily, every incident has a standardized life cycle with multiple segments:
Incident Lifecycle
- Time to Detect – The time it takes to detect that a problem, whether it is via a visual representation on a dashboard, customer call, or an alert that was triggered. There are several ways to detect a service impact, and sometimes all three occur at once: (i) customer or partner lets you know. This should be proactively avoided as this is one of the reasons to invest in monitoring in the first place; (ii) some metric on a graph is misbehaving like an increase in error rate, drop in total volume etc.; (iii) an alert was triggered by your monitoring system.
- Time to Acknowledge – The time it takes to acknowledge the problem (usually by the person who receives an alert, identifies a drop/spike on dashboard, or a complaint from a customer)
- Time to Triage – The time it takes to diagnose the problem. This is where good correlations and deep analysis offered by BI 2.0 really moves the needle. The more sophisticated a company’s alerting capabilities, the smaller the gap will be between TTT and TTD.
- Time to Recover – The time it takes to restore the service. It might be repairing the broken service, switching to DR or alternative service etc.
- Time to Fix – The time it takes to fix a problem. Sometimes the service can be recovered without fixing the root cause. This measurement captures the time when the root cause is solved – for example, replacing a fault hardware component.
- Time Between Failures – The elapsed time between inherent failures of a system during operation.
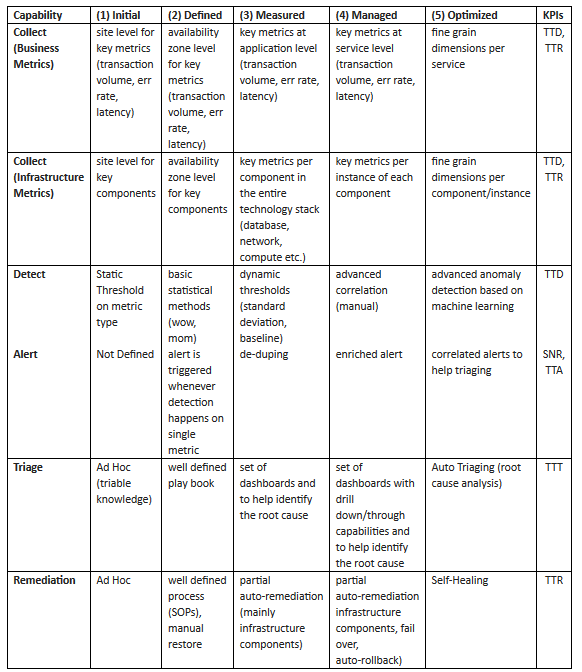
Having taken stock of how incidents are treated and responded to, companies seeking BI 2.0 now must consider the maturity model of the platform they are investing in. The following maturity level table can help companies evaluate the current state of their monitoring system and identify the most significant areas for investment with today’s KPIs.
When it comes to gaining insights out of BI, granular data offers the most accurate insights . While most existing BI solutions can process and store a huge amount of data with large number of dimensions, they don’t offer an easy way to get the insights from the data. In fact, traditional BI solutions left out the “I” – intelligence – completely in the hands and minds of data analysts. The human brain has a limited ability to process no more than a few dozen signals, exactly why organizations are often looking at the big picture and miss issues that impact a specific segment or product as the root cause is getting lost in the average.
When a ride sharing startup was in its earliest stages, a critical partner integration would break occasionally and go unnoticed for hours. Once the problem was detected, the startup’s dev ops would have to call the account manager at the partner company to have the issue fixed. The partner, with millions of merchant integrations, simply could not monitor the health of each integration, therefore compromising by looking at enterprise level KPIs (maturity level 1 for detection and 5 for collection). Four years later, the ride sharing startup became one of the partner largest customers with a huge volume of traffic. The startup didn’t stop working with the partner mainly due to personal relationship – but what if they had? How many other customers didn’t have the same personal relationship with the partner company and moved their business somewhere else?
The ideal monitoring solution is completely aware to EVERY component in the ecosystem it is monitoring in the lowest granularity, and can auto remediate issues as soon as they are detected. To get to that level of automation companies should be very confident in the quality of their system, meaning alerts should be accurate with very low (near zero) false positives. This is exactly the promise of BI 2.0 products, leveraging anomaly detection based on machine learning to detect issues while they are small so that teams can quickly resolve them and prevent them from having a significant impact on the business.
Sign up for the free insideBIGDATA newsletter.


Speak Your Mind