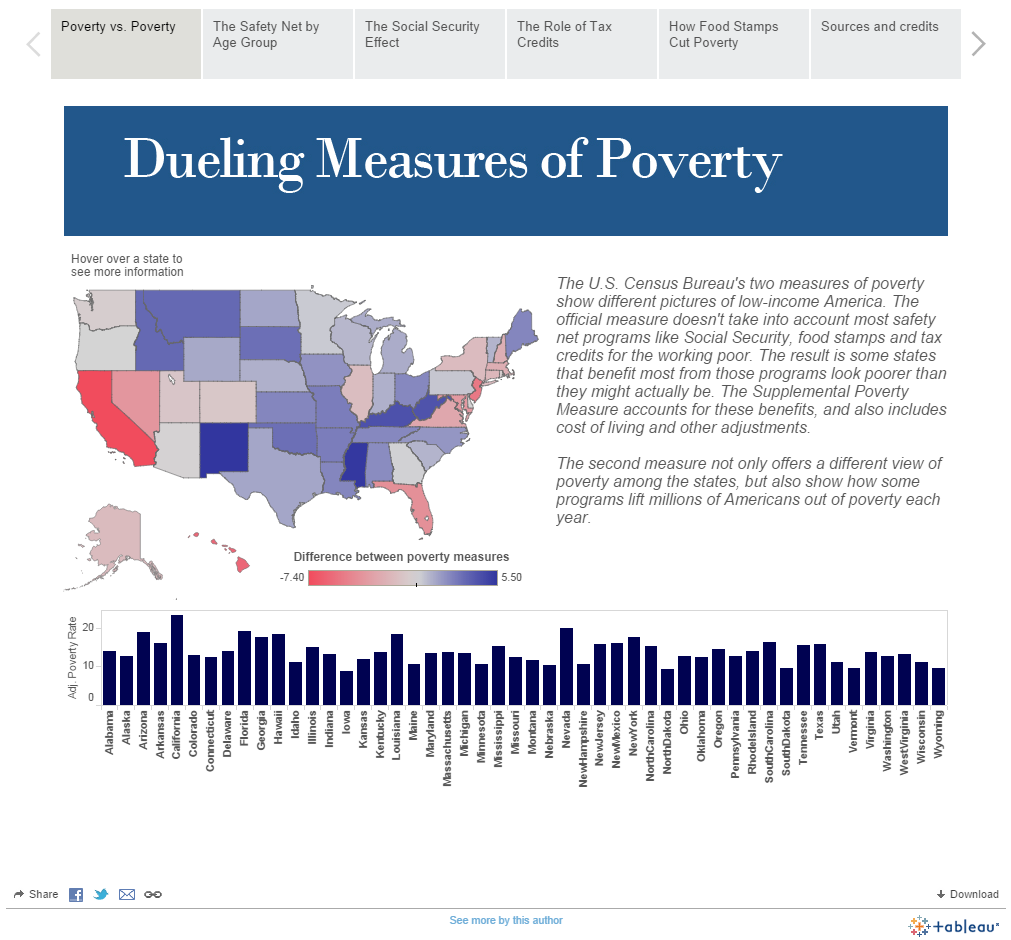
This new interactive visualization tells a compelling economic story based on U.S. Census Bureau data measuring the reach of poverty in America. Jake Grovum created this viz for Stateline exploring poverty in the United States. Click through the story points to see how different government programs affect poverty rates. You can access the interactive app HERE. The visualization was implemented using Tableau story points.
Sign up for the free insideBIGDATA newsletter.


Speak Your Mind