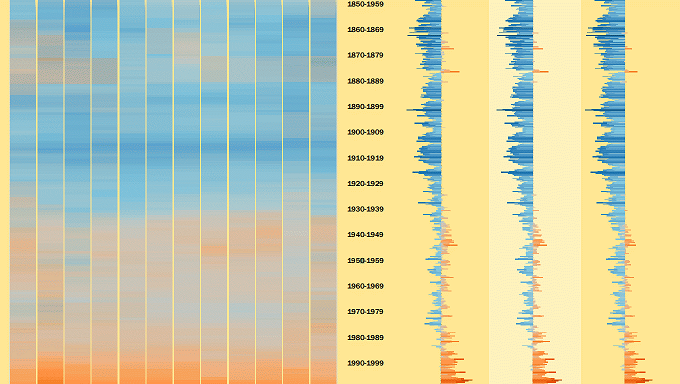
As insideBIGDATA’s visualization of the week, here’s a historical perspective of global temperature change from 1850-2016. The data is from USA Today and represent median monthly temperature differences from 1961-1990 baseline. Using Tableau Public, data author Neil Richards provides a useful data visualization during this election season where the climate change “debate” ratchets up. You can visit HERE to use an interactive version of the visualization.
Sign up for the free insideBIGDATA newsletter.


Speak Your Mind