 In this special guest feature, Will Fellers, Product Manager at Quantum Spatial Inc., explores different types of analytics – descriptive, predictive and prescriptive – and discusses how companies can leverage these tools to drive improvements to their processes and bottom line. To highlight the benefits of these three types of analytics, he will use examples from the utility industry, which relies on these methods for vegetation management. Since 2006, Will has spearheaded the technical development of a comprehensive set of innovative products utilized across technical platforms at Quantum Spatial. He and his team are currently focused on state-of-the-art solutions for remote sensing applications using machine learning/artificial intelligence systems, advanced data analytics, high performance cluster computing, immersive 3-D environments and cloud-based data distribution models.
With data being created at a rate of 2.5 quintillion bytes per day – and expected to reach an estimated 40 zettabytes by 2020 – businesses of all types are likely drowning in a tsunami of information and struggling to make sense of it all. The question businesses grapple with is no longer “Do I have enough data?” but rather “What kind of data is available, and what can I do with it?” The answer is analytics – descriptive, predictive and prescriptive – which can transform the raw data into actionable intelligence that enables a business to improve its operational efficiency, save money, comply with regulatory requirements and more.
In the utility industry, for example, companies collect a wealth of data about the vegetation surrounding their transmission and distribution infrastructure. This information helps them prevent outages and improve customer service, as well as comply with numerous regulatory requirements. Utilities collect data using a variety of remote-sensing technologies – such as multispectral, hyperspectral and thermal imaging, and LiDAR – that are capable of producing terabytes of raw data every day. These geospatial technologies enable utilities to assess tree health, take a forest inventory, analyze soil composition and conduct an inventory of their assets and infrastructure. Because these technologies produce high-resolution images, the data sets can be prohibitively large and leave companies in a state of “data overload.”
Companies experiencing this data overload need to leverage advanced analytics to rapidly extract business intelligence from vast volumes of data in order to support operational goals, drive efficiency and cost savings, and enable them to quickly and easily meet any industry-specific compliance requirements.
Descriptive Analytics: The First Step in Taming Data Overload
The raw data that businesses collect, or compile from third-party sources, is the foundation for helping companies solve problems or meet a key objective. But without other analytical tools, it’s difficult for them to address these challenges.
For utilities, descriptive analytics are the basis of vegetation management programs, providing the geospatial location of vegetation and how it relates to the nearby infrastructure, and helping them ensure they comply with industry rules. For example, Figure 1 shows that utilities use descriptive analytics to:
- Measure proximity to as-surveyed and modeled wire conditions
- Visualize the impact of vegetation on rights of ways
- Identify the address and contact information
- Document the health, species, height and volume of the surrounding vegetation.

Figure 1: Typical visual representation of descriptive analytic data captured by remote sensing technology.
Predictive Analytics: Taking Descriptive Data One Step Further
Predictive analytics leverage the results of descriptive analysis to help businesses manage risk and determine what actions need to be taken. With predictive analytics, companies can examine trends over time and quantify unknown risk factors of which they may previously have been unaware, and in the case of utilities, prioritize the potential risk of impacting customers and reduce operating expenses by adjusting their cycle-based inspections in specific areas.
Predictive analytics rely on advanced machine learning algorithms to provide risk-based models. From those models, companies can create an optimal, cost-effective work plan that combines descriptive analytics with other location- and industry-specific data sets. Utilities, for example, would incorporate data on weather, soil types, outage reports and root-cause analysis, to create a dynamic, evidence-based risk assessment.
In Figure 2, you’ll see how a utility company combined descriptive data with geographic-specific environmental and climate data. By integrating this information, the utility was able to establish a framework to help predict where vegetation poses the most risk to electricity transmission and distribution infrastructure.
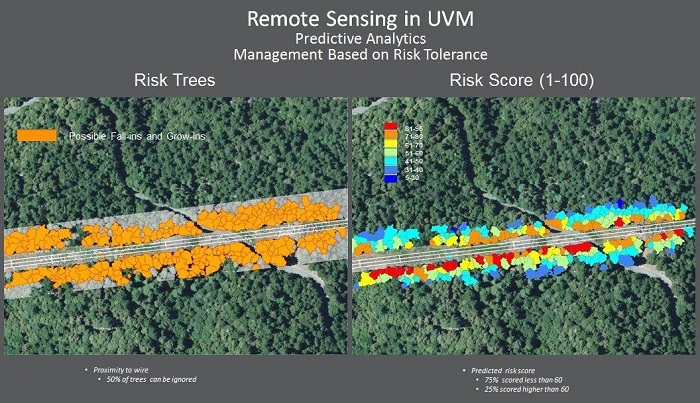
Figure 2: Predictive analytics show a utility company where there is most risk associated with vegetation around its infrastructure.
Prescriptive Analytics: Developing Actionable Insights from Descriptive Data
Prescriptive analytics enable companies to transform descriptive data into business-critical, actionable insights. Often used by management, prescriptive analytics can help optimize operations, prioritize spending by looking at condition- or risk-based models, quantify changes from past data sets, conduct audits and budget more accurately for the future.
Building on the example above, a utility can identify the riskiest vegetation using predictive analytics, then run models that help it estimate the impact of failure in certain geographical locations. The resulting intelligence is a prescriptive model (see Figure 3), which helps the utility’s management team prioritize vegetation management efforts in areas where failure would have the most impact, either on the sheer number of customers who could be affected, where there may be critical infrastructure or there is a greater risk of catastrophic fires.
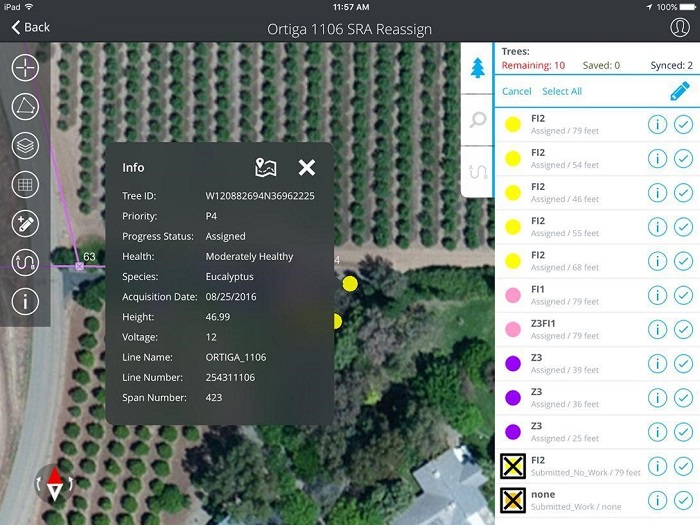
Figure 3: Prescriptive analytics enables utilities to prioritize, and more proactively address, problem areas.
While the sheer quantity of data available today, the ability to extract it for quality descriptive, predictive and prescriptive analytics is vitally important to businesses of all types. By having important insights delivered to employees in a way that is accessible and easy to understand, businesses will create advantages for themselves, whether it’s reducing costs, developing more efficient processes or ensuring regulatory compliance.
Sign up for the free insideBIGDATA newsletter.


Speak Your Mind