This article is the fifth in an editorial series that will review how predictive analytics helps your organization predict with confidence what will happen next so that you can make smarter decisions and improve business outcomes..
There is a vast array of predictive analytics tools, but not all are created equal. Software differs widely in terms of capability and usability and there are many quality tools available such like R as mentioned in last week’s article.
 Data Access for Predictive Analytics
Enterprise data assets are what feed the predictive analytic process, and any tool must facilitate easy integration with all the different types data sources required to answer critical business questions. Robust predictive analytics needs to access analytical and relational databases, OLAP cubes, flat files, and enterprise applications. The following data integration areas may be required by predictive analytics:
- Structured data sources such as traditional SQL databases and data warehouses already in use by the enterprise.
- Unstructured data sources such as social media, e-mail, etc.
- External third-party data included from vendors such as Salesforce.
Tools for predictive analytics should make integration with multiple data sources quick and straightforward without the need for exhaustive work by IT professionals and data scientists.
Users should have the flexibility to quickly combine their own private data stores, such as Excel spreadsheets or Access databases, with corporate data stores, such as Hadoop or cloud application connectors (e.g. Hadoop/Hive, Netezza, HANA, Teradata, and many others). Support for in-database,
in-memory and on-demand analytics via direct connectors are all features gaining steam in the
predictive analytics arena.
Open source R offers a low cost of entry for ample enterprise data access as it possesses many packages providing access to a wide range of data sources including ODBC databases, Excel, CSV, Twitter, Google Analytics just to name a few.
Best practice is to ensure your predictive analytics solution provides access to all types of data sources so you can combine and mashup data in any variety of ways in order to get a holistic view of the business — preferably without coding or without requiring IT involvement. This capability will empower users to derive powerful insights and make educated business decisions in real time.
Exploratory Data Analysis (EDA)
An integral step in preparing for predictive analytics is to become intimately familiar with the data, a process known as exploratory data analysis (EDA). A clear understanding of the data provides the foundation for model selection, i.e. choosing the appropriate predictive analytics algorithm to solve your business problem. Various types of software can be used by different users for an initial exploration of data.
One way to gain this level of familiarity is to utilize the many features of the R statistical environment to support this effort — numeric summaries, plots, aggregations, distributions, densities, reviewing all the levels of factor variables and applying general statistical methods. Other tools can also be used effectively for EDA including: TIBCO Spotfire, SAS, SPSS, Statistica, Matlab among many others. Statistical software, such as R, enables a user to very flexibly explore and visualize data, but requires a high level of knowledge of scripting.
Open source R has many visualization mechanisms for EDA including histograms, boxplots, barplots, scatterplots, heatmaps, and many others using the ggplot2 library. Using these tools allows for a deep understanding of the data being employed for predictive analytics. With thorough EDA you can gain important insights into the story your data is telling and how best to utilize the data to make accurate predictions.
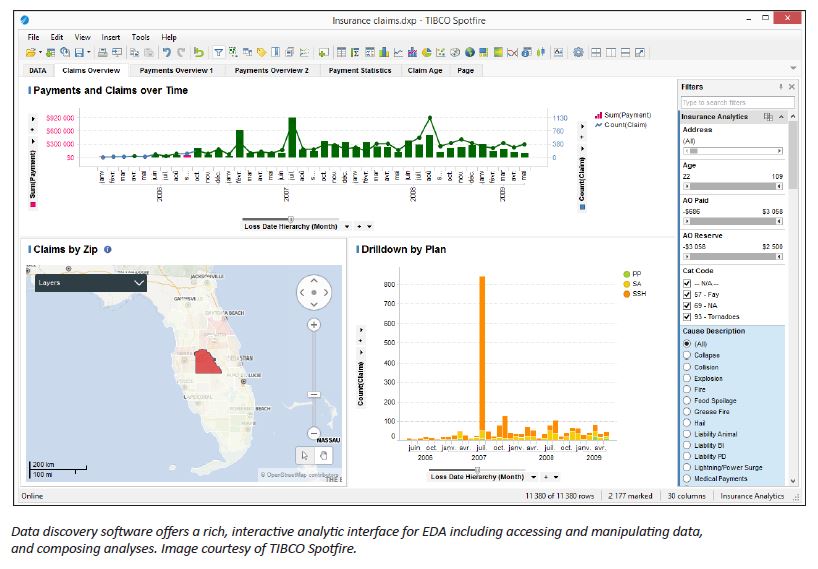
Another method for EDA is data discovery software. Data discovery, such as TIBCO Spotfire, enables a wide variety of users to visually explore and understand their data, without requiring deep statistical knowledge. Users can perform enhanced EDA tasks that can add an additional layer of insights without having to request assistance from their IT departments or data scientists.
Combining data discovery and predictive analytics capabilities on the same analytics platform is a best practice to give analytics users a seamless
experience as they move from one analytics task to another, in addition to providing a more sound total cost of ownership.
Next week’s article will look at Predictive Modeling and Production Deployment. If you prefer the complete insideBIGDATA Guide to Predictive Analytics is available for download in PDF from the insideBIGDATA White Paper Library, courtesy of TIBCO Software.


Thank you very much for this excellent article, Daniel.
I personally bet for a more intelligent automated EDA process but of course that implies using tools specifically designed to fulfill the needs of the “business” in which you are.
I’d like to share another article about the top 10 capabilities for exploring complex relationships in data for scientific discovery by means of automated EDA. It was originally written by Dr. Kirk D. Borne (@kirkdborne).
Enjoy it: http://www.butlerscientifics.com/#!Top-10-Capabilities-for-Exploring-Complex-Relationships-in-Data-for-Scientific-Discovery/ciyl/576148A1-8556-4D9C-A3F1-1DE377AA9BEE