
In this special guest feature, Ariel Assaraf, CEO of Coralogix, discusses how keeping track of your microservices is a difficult task, but not insurmountable. He takes a look at the most common techniques for getting a comprehensive view of your microservices. A veteran of the Israeli intelligence elite, Ariel founded Coralogix to change how people analyze their operation, application, infrastructure and security data—one log at a time.
A microservice architecture can be hugely beneficial when it comes to scaling, resilience and performance. These traits are all essential to ensure you can keep up with demand and deliver a service that delights your customers.
Unfortunately, microservices also bring new challenges. Where once you had a single, monolith instance, you’re now juggling a complex system of dozens, potentially hundreds, of different instances that each have their own quirks.
Keeping track of your microservices is a difficult task, but not insurmountable. Let’s look at the most common techniques for getting a comprehensive view of your microservices.
The new challenges that come with Microservices
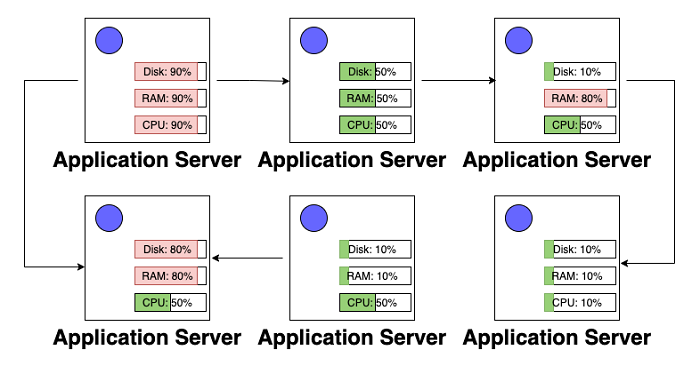
Within a microservice architecture, there are some new metrics and behaviors that need to be tracked. Let’s begin by looking at a monolithic application, and view some of the most operational metrics.
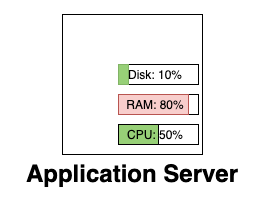
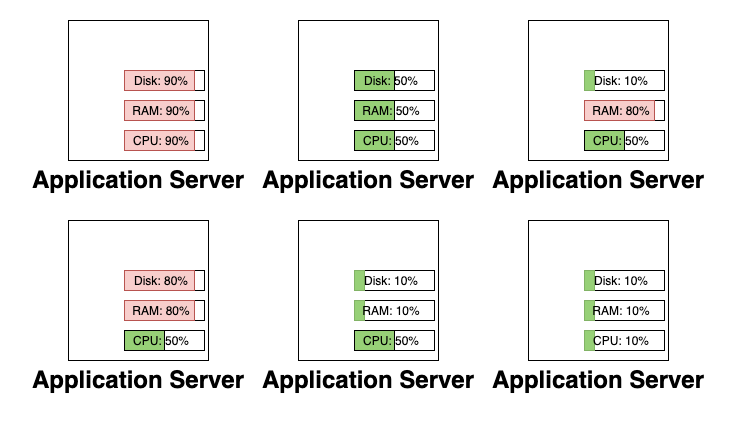
A monolithic application is commonly a single instance (or multiple identical instances). This means that we can consider the entire “system” as wrapped up within that box. There’s only one set of RAM, CPU and disk space metrics to follow. When we move to a microservices architecture, we have many simultaneous boxes that must be tracked.
But there are some new behaviors too
A common feature of microservice architectures is that a single action can span multiple services. For example, a “pay” button on the website may first need authorization, then auditing, then inventory management and finally payment. The microservices philosophy advocates for splitting up these responsibilities into their own services.
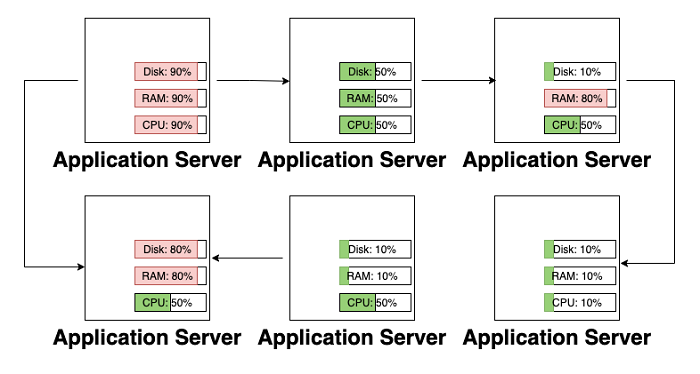
Now, rather than simply looking at the operational health of an instance, we need to look at the actual running behaviour of the deployments. This means tracking requests as they move through various instances. This new technique is known as tracing.
And things can become a little chaotic
Another new concept that drives up the observability challenge is a new feature in modern software systems – chaos. Chaos describes the regular disappearance, disconnection or temporary failure or a component in your system. Again, this wasn’t addressed in-depth in a monolithic architecture because change was so infrequent.
One of the great powers of a microservices approach is the ability to make many parallel changes, without these changes interfering with one another. With so much happening at once, chaos becomes a natural property of any system. So much so, it has given rise to an appropriately named engineering practice – chaos engineering – that encourages engineers to regularly inject faults into their software system.
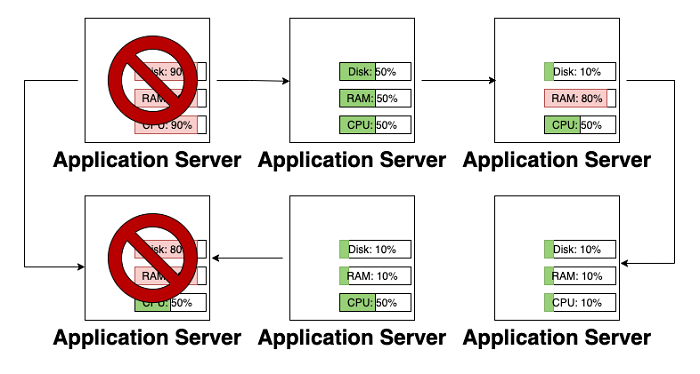
Chaotic services are a little tricky to monitor. If it disappears for 30 seconds, is the node gone or has the process simply died and in the process of being restarted? Has the network link been severed? Your observability stack needs to be able to keep track of this.
So where do you start with all of this?
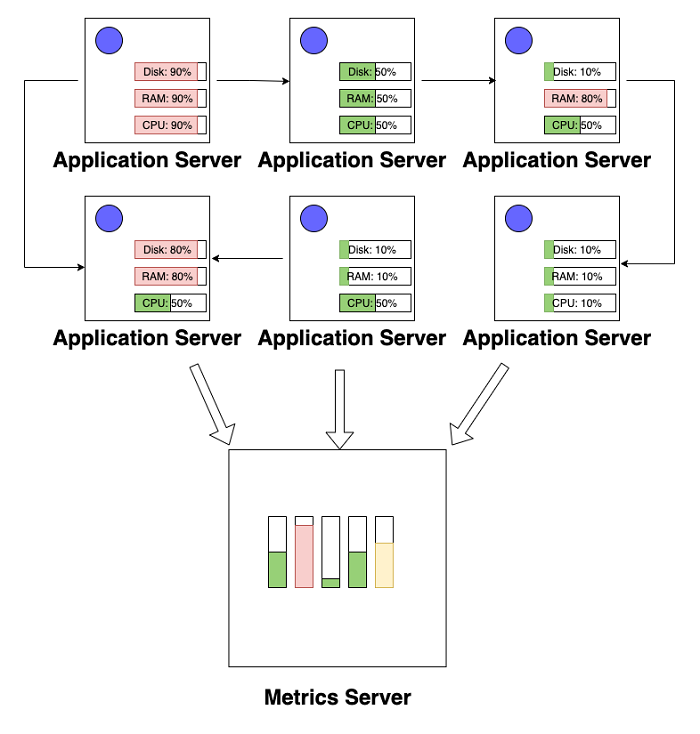
The first step in getting your microservices under control is the surfacing and aggregation of data. Rather than scraping a single node, you need a mechanism that can automatically begin capturing metrics from your system, even as new nodes appear and disappear.
Standardize the creation of instances
To begin with, you need to create a single, standard process, through which new virtual machines are created. A simple option is to create a machine image, such as an Amazon AMI, and make this the base for your instances. Within this machine image, you can install logging and metrics agents that will surface those vital measurements you need to keep track of your microservices.
A more sophisticated option is to implement a single platform, on which all of your software is deployed. For example, a Kubernetes cluster. This increased uniformity means that your system develops an underlying consistency, on which new automation can be built. This consistency means that you always have a minimum level of visibility and it minimizes opportunities for engineering teams to drift away from their goal.
Create a single place for all of this data
Once your applications are surfacing all of this information, you can begin harvesting. This means bringing all of your data into a single place. This single place needs to have some core capabilities:
- Be able to handle scaling volumes of data
- Enable users to dynamically query the data however they like
- Enable operations teams to visualise this data in graphs
- Allow engineers to set up alerts based on this data
The process of collecting and harnessing all of this data is known as aggregation. Aggregation is easier said than done – this service needs to be extremely resilient. If it breaks for some reason, your services have essentially gone dark and you’ll need to work out how to turn the lights back on.
But how do you see the connections between the services?
Each service in your architecture is regularly communicating with other services. Above, we referred to the monitoring of this traffic as “tracing”. So how do we go about creating this capability? Well, there are quite a few options.
You could route all traffic through a single proxy
In the past, one option has been to create a single API layer for all of your services. This API layer can keep track of who is requesting what in your system. These metrics can then be exposed and aggregated. This gives you a basic grasp of your services, but it doesn’t necessarily enable you to keep track of the progress of a single transaction through your system. That work is still ahead of you.
Not to mention the risks with a single proxy!
If your API layer stops processing traffic, you’ve just lost access to all of your services. Despite the underlying services functioning perfectly, your applications are all configured to go through a single point. What we need is a distributed set of proxies, but a centralised method of configuring them. This would be a huge engineering effort, right? Thankfully, no.
Introducing the Service Mesh
A service mesh is, initially, a little strange. Rather than creating a single point of failure through which all of your traffic flows, the service mesh embraces the realities of a microservice architecture. Each of your applications are coupled with a proxy instance of their own. This proxy instance captures all ingress and egress traffic for this application. It can capture latency metrics, detect errors, permission failures, sudden traffic spikes and much more.
Can you configure other rules in your service mesh?
Yes! The other part of a service mesh is known as the “control plane”. This is a central repository of configuration for each service proxy. You can block or reroute traffic. You can even perform fault or latency injection, if you wish to be able to simulate errors in your software to test your resiliency (remember chaos engineering from before?).
Will a service mesh track single requests?
While the features of a service mesh differ between providers, it is very common for a service mesh to include session IDs and transaction IDs on each request. This enables the system to tie together multiple different requests into a single transaction. Service meshes such as Istio come with tools like Kiali, that can automatically visualise these transactions and provide a live architecture diagram of your software.
How is a service mesh most commonly implemented?
The most common service mesh in use today is Istio. Istio is designed to run within a Kubernetes cluster. Most service mesh implementations are optimized for use with Kubernetes, although many of them do claim to work outside of Kubernetes clusters too.
All in all…
Microservices introduce complexities, but their benefits can not be ignored. With some planning, the right tools and some consistency within your platform infrastructure, you’ll be able to grow and scale your system with total confidence.


Speak Your Mind