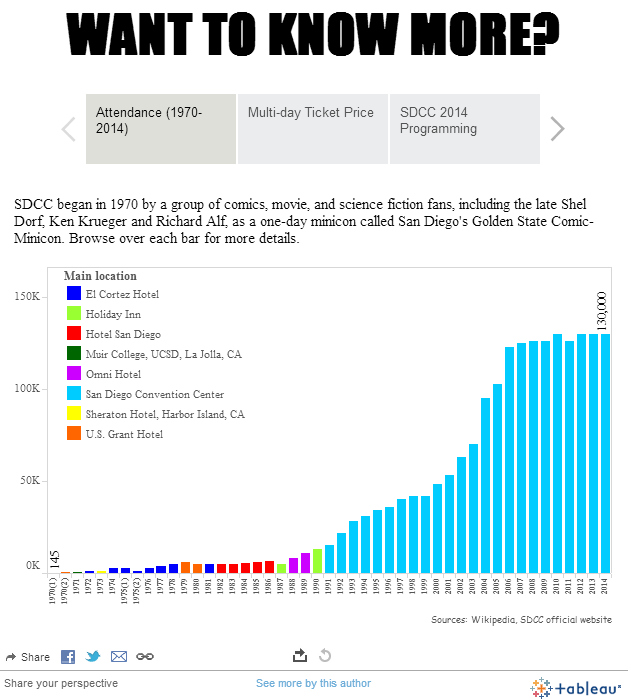
This visualization is especially meaningful to our Southern California readers who may have taken time off of their big data challenges to attend the San Diego Comic-Con. Our friend Kuang Keng Kuek Ser utilized Tableau software to visualize the attendance of this past weekend’s San Diego Comic-Con 2014. Click HERE to experiment with the live […]
Tableau 8.2 Brings Data to the Mac and Data Storytelling to Everyone
June 19, 2014 by Leave a Comment
Tableau Software (NYSE: DATA) today announced the general availability of Tableau 8.2, an update that brings Tableau to Mac users around the world and adds a feature to help people tell stories with their data. With Tableau 8.2, Mac users will have a fully-featured analytics application that lets them ask questions of their data. Story Points will allow everyone to create interactive, data-driven stories that they can share with their organizations, networks and the world.
Visualization of the Week: Measuring the Housing Market
June 9, 2014 by Leave a Comment

Freddie Mac created an intriguing visualization on its inaugural Multi-Indicator Market Index. Below is a sample visualization using Tableau. To use the interactive visualization, click HERE. Use the maps to select a state and explore the data on a national, state and metro level. Sign up for the free insideBIGDATA newsletter.
MapR Technologies Launches Industry’s First Apache Hadoop Application Gallery
June 3, 2014 by 2 Comments
MapR Technologies, Inc., provider of a leading distribution for Apache Hadoop, today launched at Hadoop Summit the industry’s first Hadoop application gallery. Launching with solutions from a wide range of Hadoop ecosystem partners, the MapR App Gallery is designed to help customers derive greater business value from big data as they scale-out their enterprise data architectures.
Alteryx and DataSift Partnership Unifies Social and Enterprise Data
May 28, 2014 by Leave a Comment
Alteryx, Inc., a leader in data blending and advanced analytics, and DataSift, a leading enterprise social data platform, has announced a global partnership to provide an intuitive way for the millions of analysts in departments such as marketing, merchandising and supply chain to blend social data with other data sources for advanced analytics that deliver deeper business insights.
Visualization of the Week: MLS 2014 Players Salary
May 2, 2014 by Leave a Comment
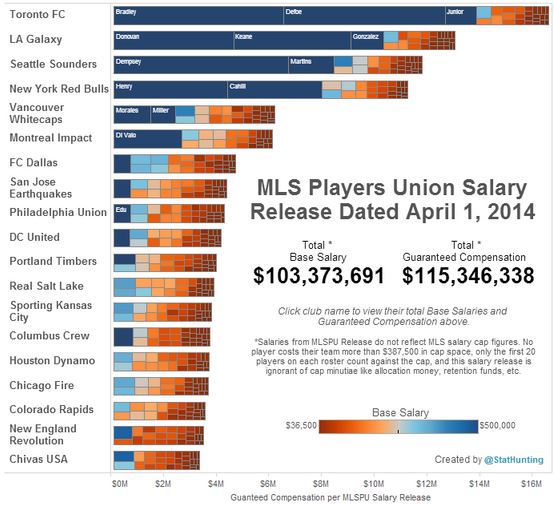
Here is an intriguing sports visualization from our friend Steven Fenn over at the Stat Hunting blog for the 2014 MLS salaries by player and team.
Data Scientists Losing their Sex Appeal?
April 22, 2014 by 2 Comments
At year end 2013, a probing article appeared in CMS Wire, “The End of Data Scientists and Other Predictions.” I remember reading it at the time and thinking to myself, “Oh well, I better fire up a screenplay template in Word like everyone else here in LA and start typing because I’ll be out of work soon.”
Tableau in the Cloud Continues to Grow
April 8, 2014 by Leave a Comment

Tableau Software (NYSE: DATA) today announced that more than 1,000 customer accounts are using its cloud-based product, Tableau Online. The milestone comes just nine months after the company announced the hosted version of Tableau Server, making it Tableau’s fastest-growing product.
Cloudera Enterprise 5 Released
April 2, 2014 by Leave a Comment
Cloudera, a leader in enterprise analytic data management powered by Apache Hadoop™, today announced the general availability of Cloudera Enterprise 5, the latest release of Cloudera’s Hadoop platform that sits at the core of an enterprise data hub.
The Zen of Visual Analysis
March 24, 2014 by Leave a Comment

“Tableau Desktop is based on breakthrough technology from Stanford University that lets you drag & drop to analyze data. You can connect to data in a few clicks, then visualize and create interactive dashboards with a few more. We’ve done years of research to build a system that supports people’s natural ability to think visually. Shift fluidly between views, following your natural train of thought. You’re not stuck in wizards or bogged down writing scripts. You just create beautiful, rich data visualizations.”


